Monitoring & debugging
Every deployment has a dashboard with the three signals you reach for when something is off — usage charts, log output, and the underlying cluster events.
Metrics#
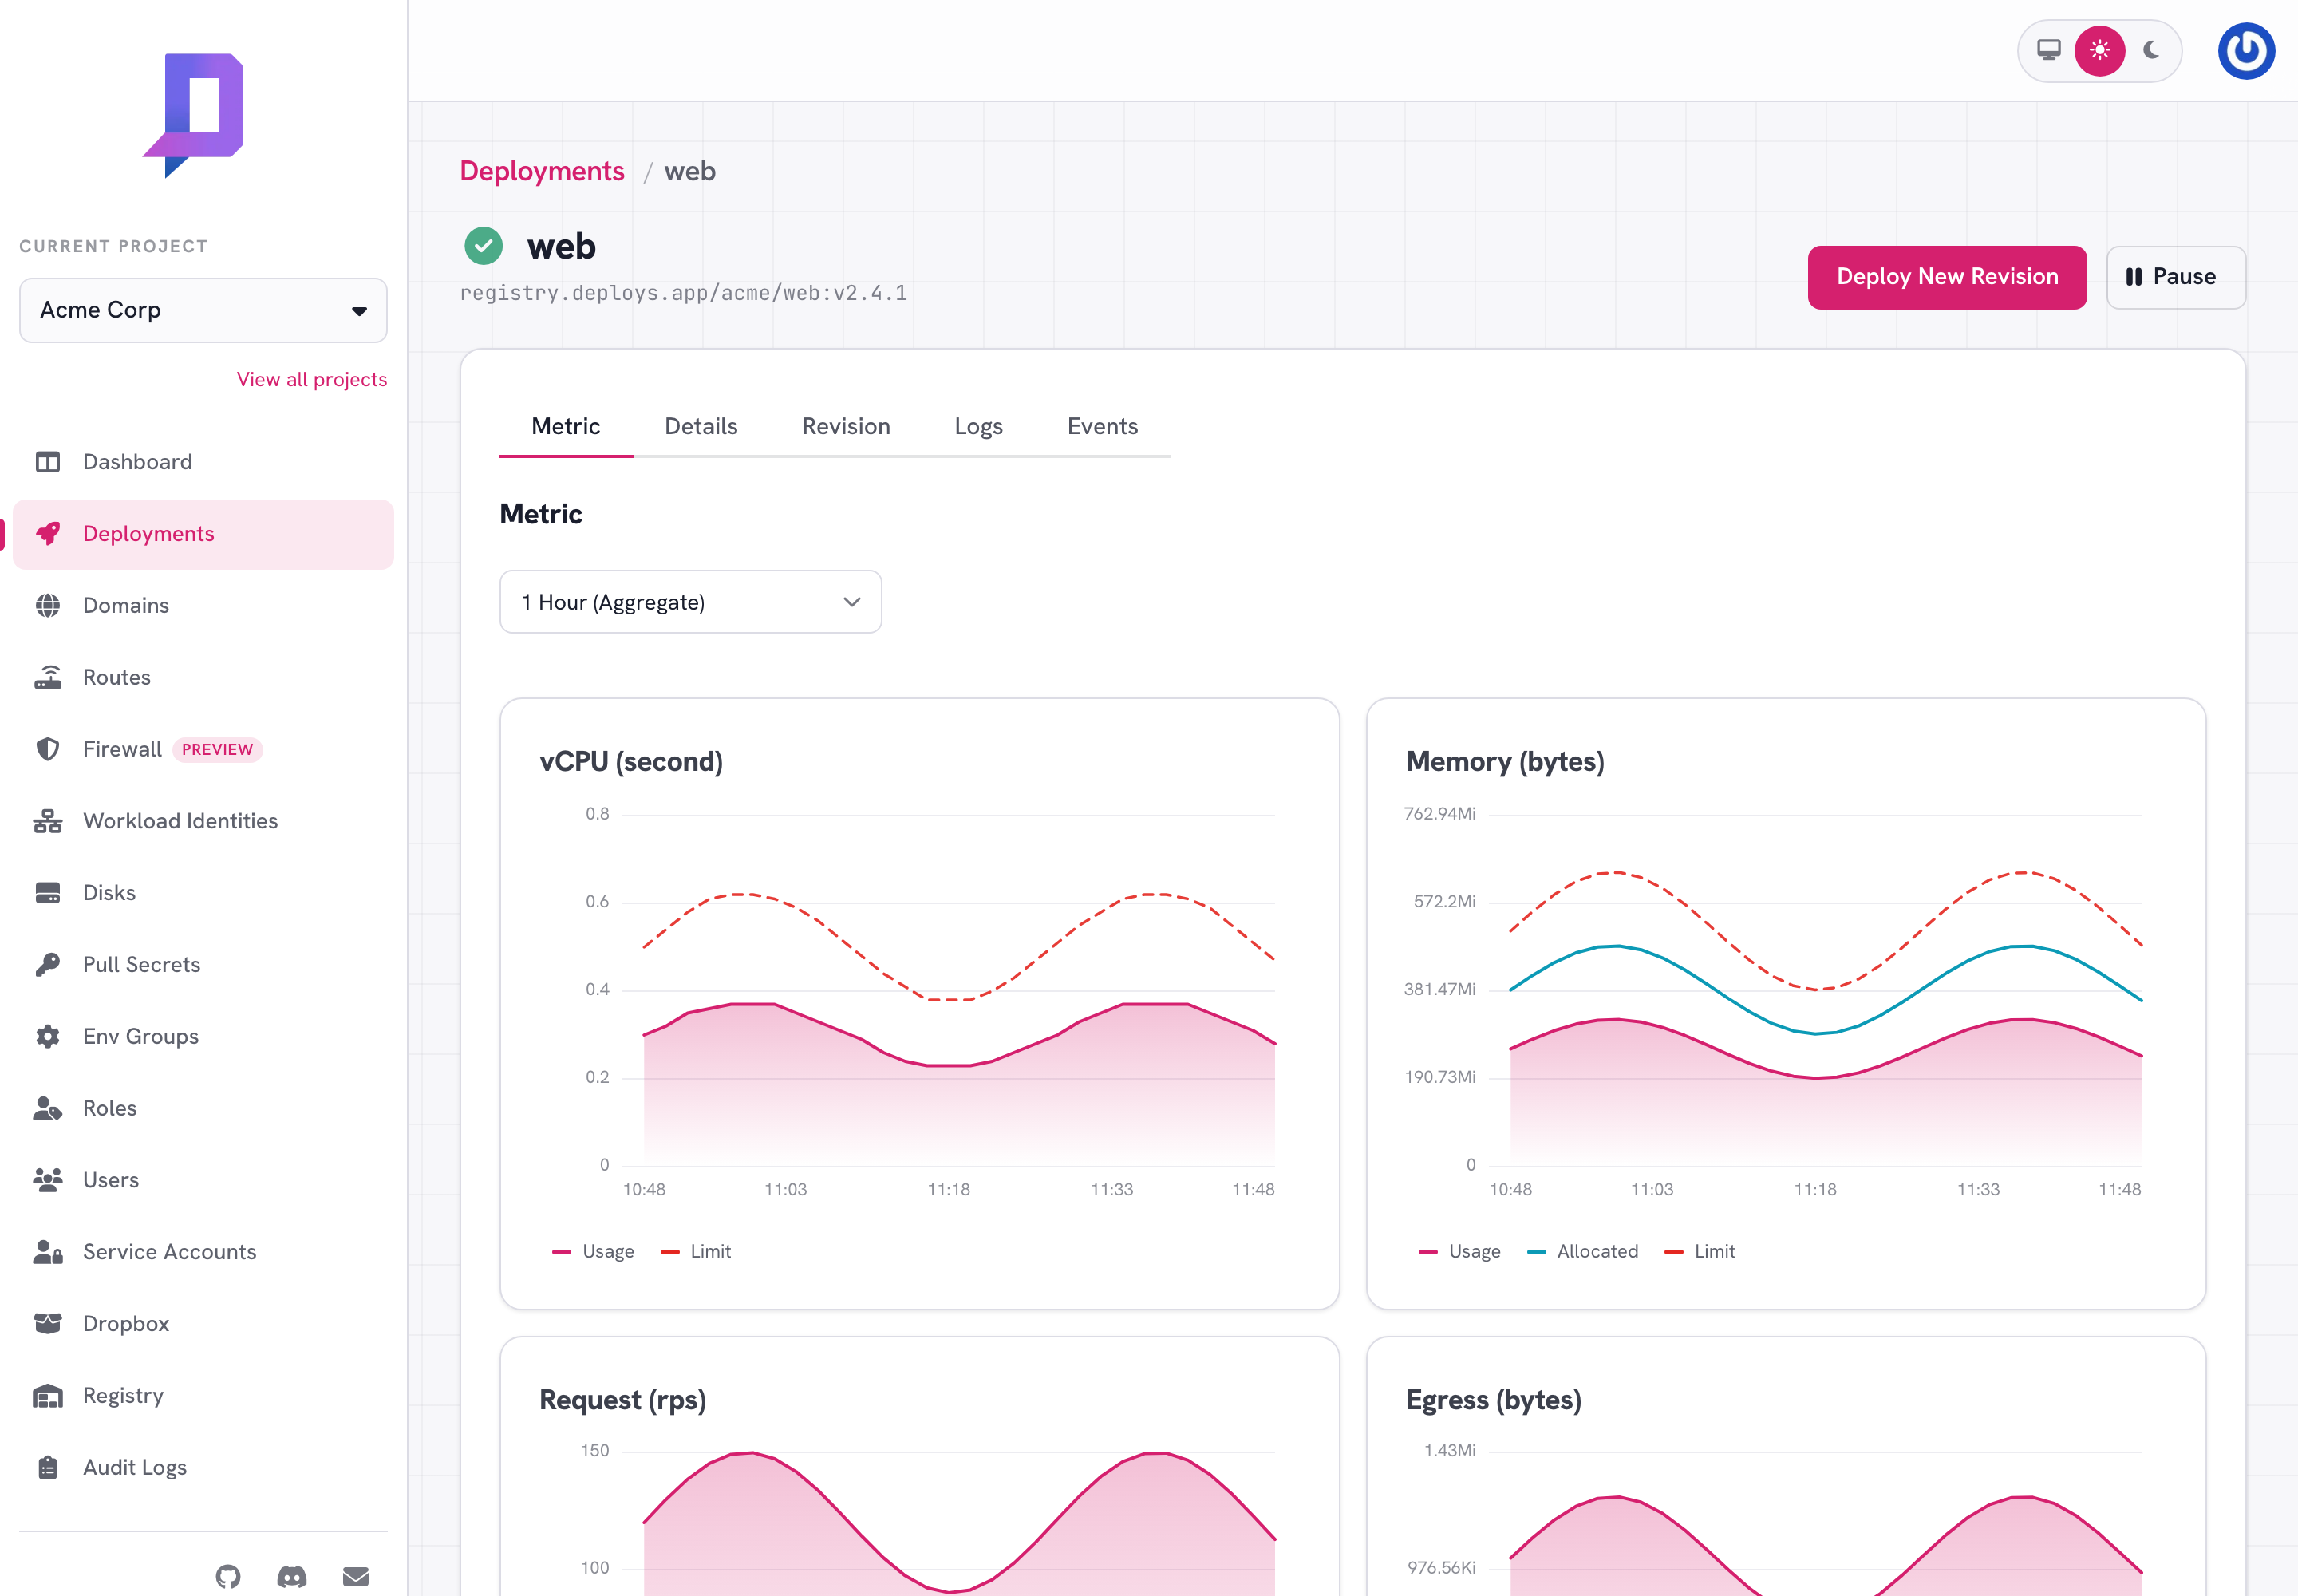
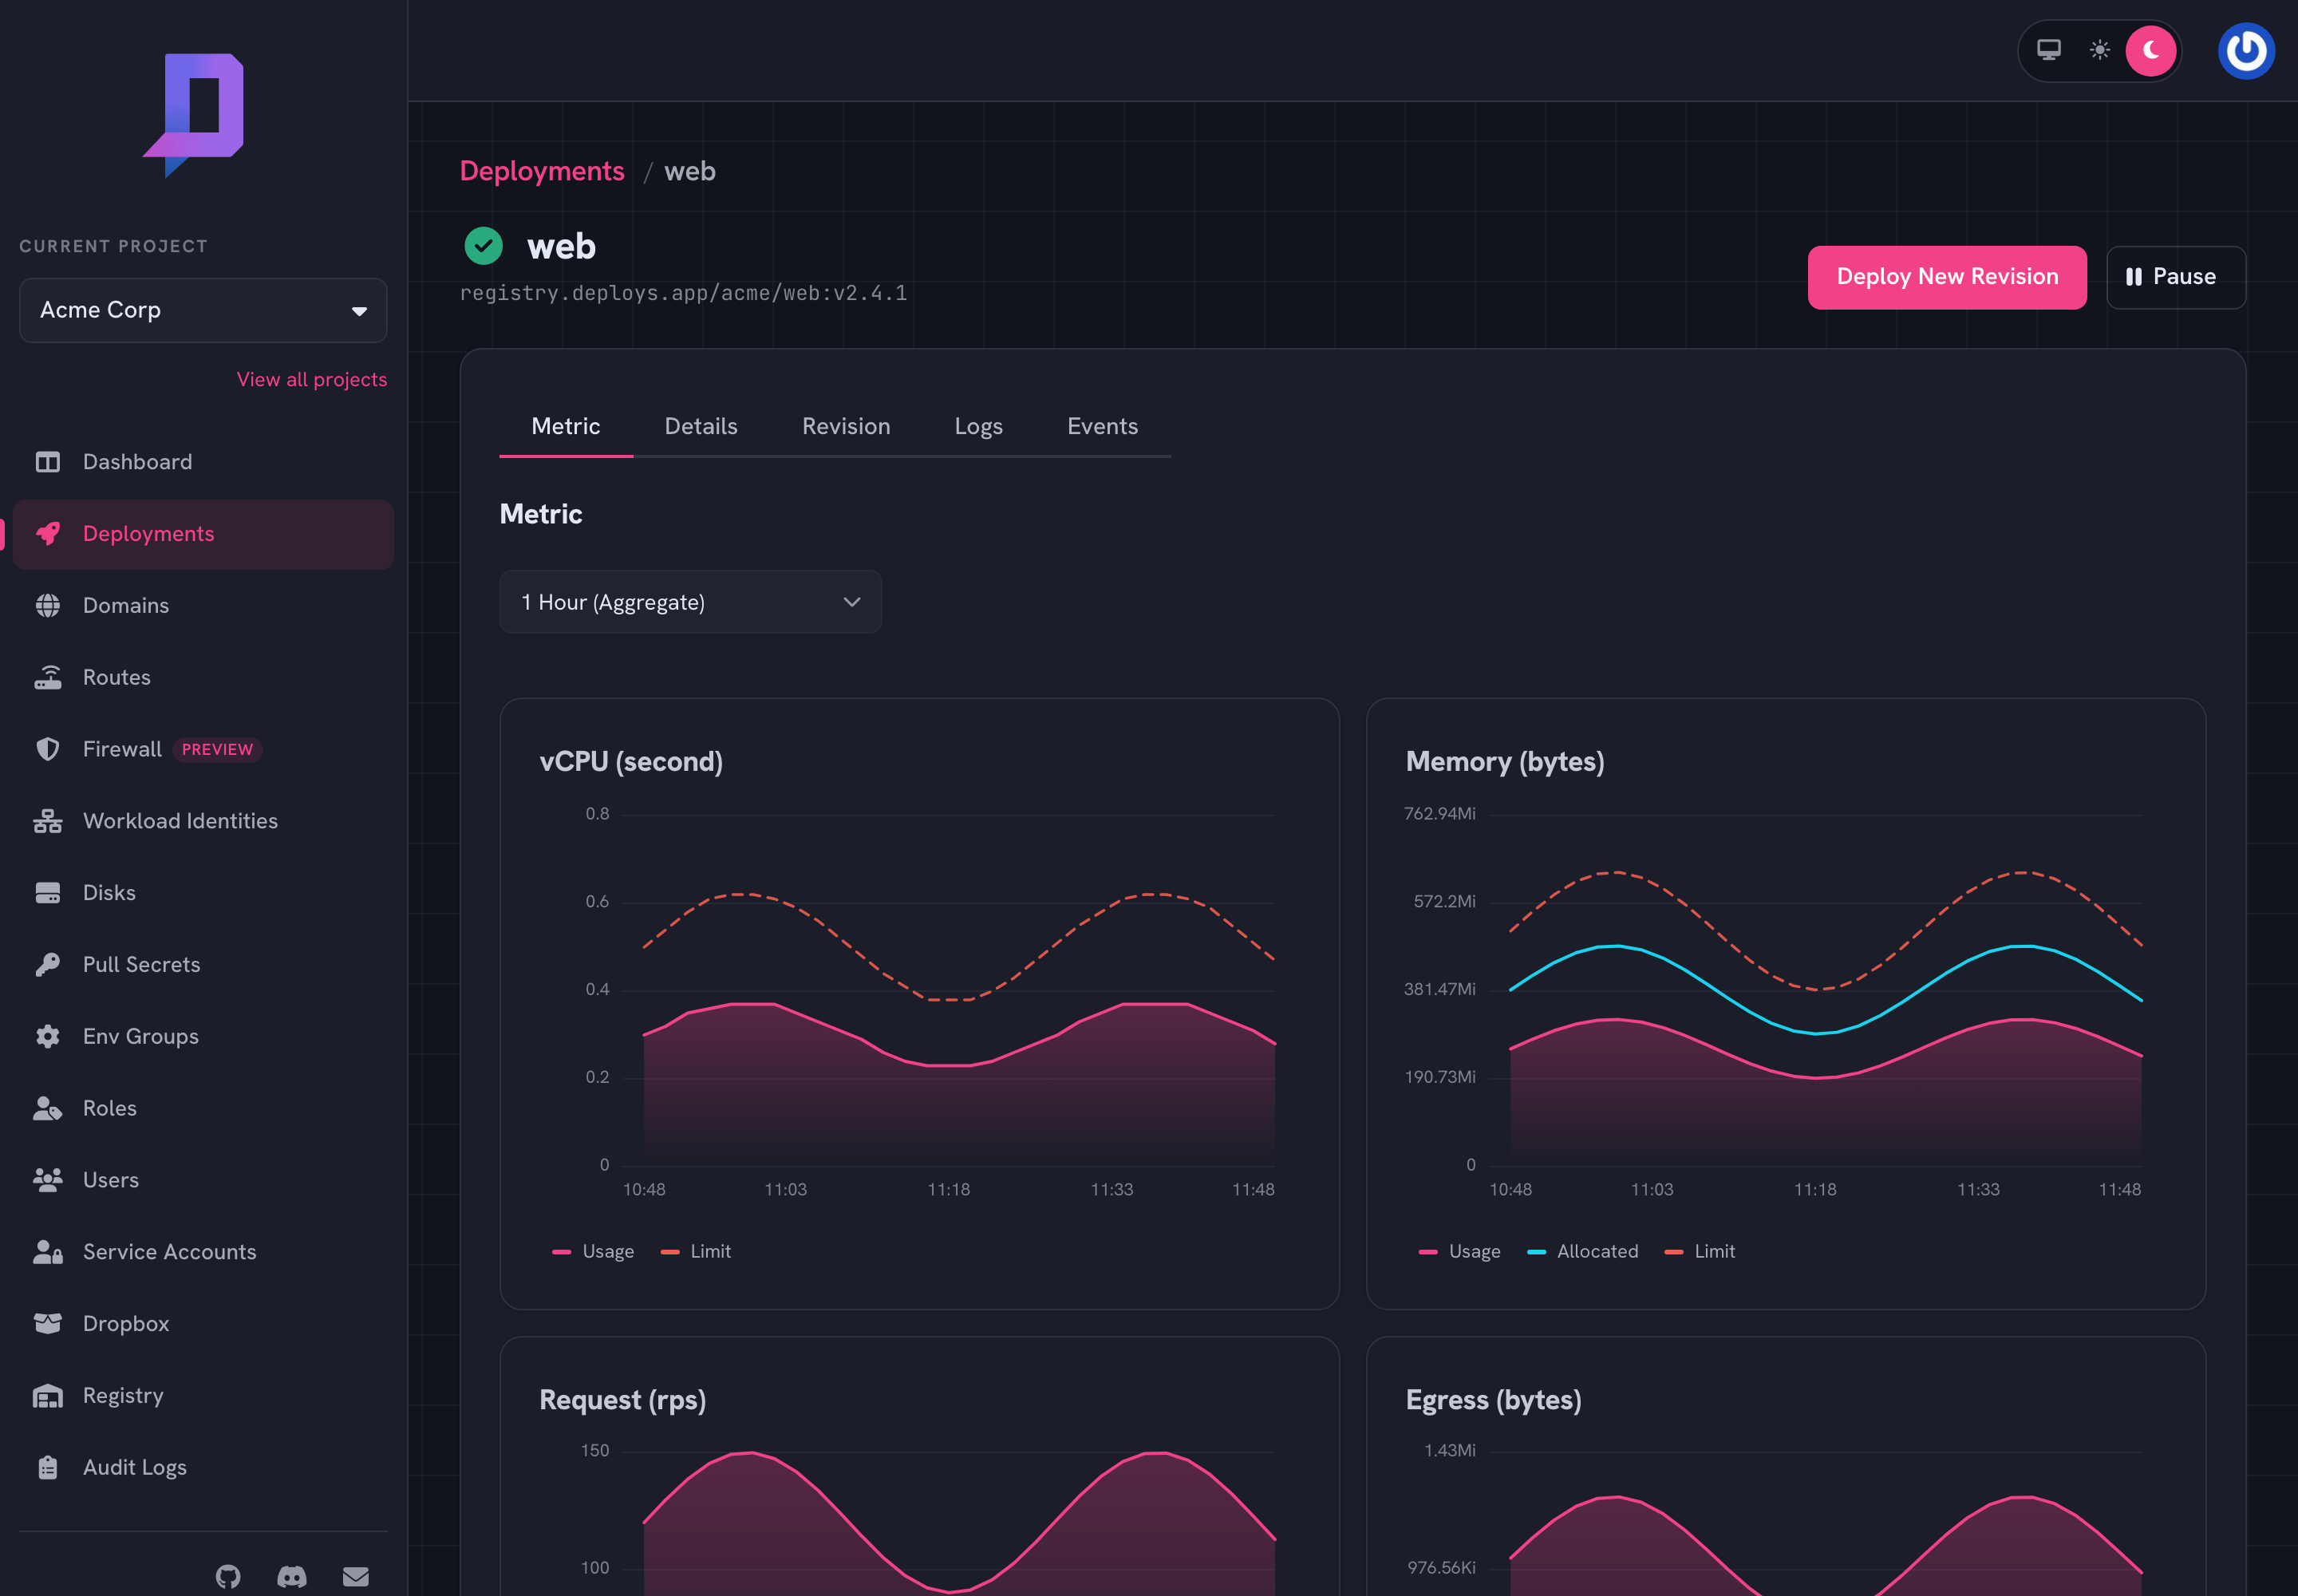
The Metric tab plots CPU, memory, request rate, and egress for the deployment. Both usage and allocated (request) lines are shown — the gap between them tells you whether you’re under- or over-provisioned. The time-range selector spans 1 hour aggregate, 1 day, 7 days, and 30 days.
Metrics are also available from the API as time-series:
curl https://api.deploys.app/deployment.metrics \
  -H "Authorization: Bearer $DEPLOYS_TOKEN" \
  -d '{ "project": "acme", "location": "gke.cluster-rcf2",
        "name": "web", "timeRange": "1d" }'
The response is a set of named series, one per metric, each a list of
[unixSeconds, value] points.
Logs#
The Logs tab streams the deployment’s stdout and stderr. Hit Stream Raw
Logs to switch to a continuous follower (the default view is bounded to
the recent buffer). All replicas are interleaved — each line is prefixed with
its pod name so you can tell them apart.
Things to know:
- Logs are not retained indefinitely. Persist anything you care about long-term by shipping it to your own log aggregator (the platform doesn’t ingest them for you).
- High-volume log output (thousands of lines per second) can be sampled. Keep log lines short; bury big payloads in your aggregator instead.
Kubernetes events#
The Events tab shows the cluster events behind the deployment — image-pull failures, OOM-kills, scheduling delays, readiness check fails. This is the first place to look when a deploy gets stuck “Pending.”
Common patterns:
ImagePullBackOff— the image isn’t reachable. Check the image name and digest, and confirm the pull secret if it’s a private registry.OOMKilled— your container exceeded its memory limit. Raiseresources.limits.memoryor fix the leak.Insufficient cpu/Insufficient memory— the cluster can’t schedule the requested resources right now. Lower the request or pick a different location.
What runs where#
Everything you see in the dashboard is computed from data the platform collects passively — there’s nothing to instrument inside your container.
| Signal | Source |
|---|---|
| CPU / memory usage | Pod cgroups, scraped at 60 s intervals |
| Request rate / egress | The ingress and routing layer |
| Logs | Container stdout / stderr, streamed via the events channel |
| Events | Native Kubernetes events for the deployment’s pods |
Alerting#
The platform doesn’t ship its own alerting. The recommended pattern is to
poll deployment.metrics from your own monitoring system (Grafana,
Datadog, Honeycomb, …) and define alerts there — usage data is the same
underlying time-series the dashboard reads.
A small service account with read-only permissions is the right principal for this:
deploys role create --project acme --role metrics-reader \
  --permissions deployment.list,deployment.get,deployment.metrics
Bind it to your monitoring service account and use the credentials in your exporter.